Developing a Custom Apache Nifi Reporting Task
Reporting tasks are background tasks commonly responsible for communicating system’s state, flow metrics, and other information commonly used for monitoring and alerting. The current list of reporting tasks cover a great deal of information and generally available as site to site reporting tasks. This generally means sending the data back into a flow to filter and transform before sending to its destination. While this works incredibly well, if the flow would require a custom processor, in its place you could develop a custom reporting task. The full source is hosted on Github or Gitlab.
Setup
This example introduces docker and docker-compose to provide InfluxDB for hosting the metrics, Graphana for the display, and Apache Nifi. To setup docker and docker compose follow the official docker-ce installation instructions here.
This example is not meant for production, but we will cover the parts of a reporting task and it’s available resources. Lets start with a description of the boiler plate and structure. If you have read the posts on developing a custom processor or controller service this will be very familiar.
Apache Nifi Reporting Task Folder Structure
sample-reporting-task
├─ pom.xml
├─ src
│  └─ main
│     ├─ java
│     │  └─ rocks
│     │     └─ nifi
│     │        └─ examples
│     │           └─ processors
│     │              └─ reporting
│     │                 ├─ BulletinReportingTask.java
│     │                 └─ InfluxBulletinReportingTask.java
│     └─ resources
│        └─ META-INF
│           └─ services
│              └─ org.apache.nifi.reporting.ReportingTask
sample-reporting-task-nar
└─ pom.xml
I won’t go into details on the pom files but the general idea is that you want a seperate nar for the reporting task, seperated from the rest of the components. You will also see the org.apache.nifi.reporting.ReportingTask file under resources, this is responsible for registering your reporting task with the Apache Nifi class loader. The sample also splits the reporting task in two. So the bulletin tasks are retrieved in one and the Influx integration is maintained in the other. So lets begin.
The Reporting Task
If you have read the developing a custom processor post a lot of this will be review. Reporting tasks provide the same interfaces for configuration and validation, the initialization method only differs in taking a ReportingInitializationContext.
Just like with the processors, tags are useful for finding your controller services once deployed. The capability description annotation provides a simple explanation of what the controller service will provide.
BulletinReportingTask.java: Bulletin Reporting Task
@Tags({"nifirocks", "bulletin", "metrics"})
@CapabilityDescription("Report bulletin metrics")
public abstract class BulletinReportingTask extends AbstractReportingTask {
Next we create the property descriptors. This again mimics the processors and controller services. In the bulletin reporting task we enable three filters, source id for an individual processor, group id, or message regex. In the influxdb extension we setup the host path, database name, and a metric name for a tag on the values. Below is a consolidated view with one new element added that was not present in previous posts, a validator. The validator needs to be positioned or included before being set by the property descriptor and implements the Validator interface method validate. This simple function tries to ping the influx db and return the expected ValidationResult. Validators can greatly reduce errors for users by notifying them ahead of time that a property is invalid, and not after the processor, service, or task started.
InfluxBulletinReportingTask.java: InfluxDB Reporting Task
public static final Validator INFLUX_HOST_VALIDATOR = new Validator() {
        @Override
        public ValidationResult validate(String subject, String input, ValidationContext context) {
            ValidationResult.Builder builder = new ValidationResult.Builder()
                    .subject(subject)
                    .input(input);

            try {
                InfluxDB influxDB = InfluxDBFactory.connect(input,"user", "pass");
                Pong p = influxDB.ping();
                if(p.getResponseTime() > 0){
                    builder.valid(true).explanation("connected to " + input + " in " + p.getResponseTime());
                }else{
                    builder.valid(false).explanation("Failed to connect to " + input);
                }
            }catch (final IllegalArgumentException e) {
                builder.valid(false).explanation(e.getMessage());
            }

            return builder.build();
        }
    };

    public static final PropertyDescriptor INFLUXDB_PATH = new PropertyDescriptor.Builder()
            .name("Influxdb path")
            .required(true)
            .addValidator(INFLUX_HOST_VALIDATOR)
            .defaultValue("http://localhost:8086")
            .build();

    ...

    @Override
    public void init(final ReportingInitializationContext context){
        super.init(context);

        properties.add(INFLUXDB_PATH);
        properties.add(INFLUXDB_NAME);
        properties.add(INFLUXDB_METRIC);

        properties = Collections.unmodifiableList(properties);
    }
The next step is the onScheduled function which will read the properties set and call any other necessary functions needed to run the reporting task. The BulletinReportingTask pulls in the generic filters, and the InfluxBulletinReportingTask pulls in connection and database information for influxdb.
InfluxBulletinReportingTask.java: Bulletin Reporting Task
protected void onScheduled(final ConfigurationContext context) {
    sourceId = context.getProperty(SOURCE_ID).getValue();
    groupId = context.getProperty(GROUP_ID).getValue();
    message = context.getProperty(MESSAGE_MATCH).getValue();
}
InfluxBulletinReportingTask.java: InfluxDB Reporting Task
@OnScheduled
public void onScheduled(final ConfigurationContext context) {
    // setup, to initiate stuff based off of context that will not change between onTriggers
    super.onScheduled(context);
    host = context.getProperty(INFLUXDB_PATH).getValue();
    name = context.getProperty(INFLUXDB_NAME).getValue();
    metric = context.getProperty(INFLUXDB_METRIC).getValue();
}
This is the first time in the deveopment series on NiFi.rocks we are covering the support of dynamic properties. So this chunk can be used in custom processors and controller services as well. It allows a user to add properties in the configuration panels. In this use case we are allowing users to configure multiple tags to apply to the out going data to influxdb. The function, getSupportedDynamicPropertyDescriptor returns a new property to represent each dynamic property added. These new properties can take on all of the normal property parameters and functions.
InfluxBulletinReportingTask.java: InfluxDB Reporting Task
@Override
protected PropertyDescriptor getSupportedDynamicPropertyDescriptor(final String propertyDescriptorName) {
    return new PropertyDescriptor.Builder()
            .name(propertyDescriptorName)
            .addValidator(StandardValidators.NON_EMPTY_VALIDATOR)
            .description("tag name and value")
            .dynamic(true)
            .expressionLanguageSupported(true)
            .required(false)
            .build();
}
To see the other private functions you can refer to the github code.
The last important part of the code is the onTrigger where the actually schedule task is run.
InfluxBulletinReportingTask.java: InfluxDB Reporting Task
@Override
public void onTrigger(final ReportingContext context) {
    final long timestamp = System.currentTimeMillis();

    Map<String, String> tags = new HashMap<>();
    context.getProperties().entrySet().stream()
            .filter((entry) -> entry.getKey().isDynamic())
            .forEach(entry -> tags.put(entry.getKey().getName(), entry.getValue()));

    InfluxDB influxDB = InfluxDBFactory.connect(host, "user", "pass");
    BatchPoints.Builder batch = BatchPoints.database(name);
    tags.forEach((key, value) -> batch.tag(key, value));

    try {
        Map<String, AtomicInteger> counts = new HashMap<>();
        counts.put("INFO", new AtomicInteger(0));
        counts.put("WARNING", new AtomicInteger(0));
        counts.put("ERROR", new AtomicInteger(0));

        List<Bulletin> bulletins = getBulletins(context);
        for (Bulletin bulletin : bulletins) {
            if (bulletin.getLevel().equalsIgnoreCase("INFO")) {
                counts.get("INFO").incrementAndGet();
            } else if (bulletin.getLevel().equalsIgnoreCase("WARNING")) {
                counts.get("WARNING").incrementAndGet();
            } else if (bulletin.getLevel().equalsIgnoreCase("ERROR")) {
                counts.get("ERROR").incrementAndGet();
            }
        }

        counts.forEach((key, value) -> {
            Point.Builder point = Point.measurement(metric)
                    .time(timestamp, TimeUnit.MILLISECONDS)
                    .tag(metric, key)
                    .addField("value", value.intValue());
            batch.point(point.build());
        });

        influxDB.write(batch.build());

    } finally {
        influxDB.close();
    }
}
In this event we are looping over the properties and pulling all the dynamic values into a map of tags, forming the database connection to influxdb, grabbing all of the bulletins using the parents getBulletings function, and finally writing it out to influxdb.
Please view the full github repository for the rest of the private functions responsible for obtaining and reporting these values.
Great, now that we have covered the code let’s run it!
docker-compose up --build
This should start three service, nifi, influxdb, and graphana.
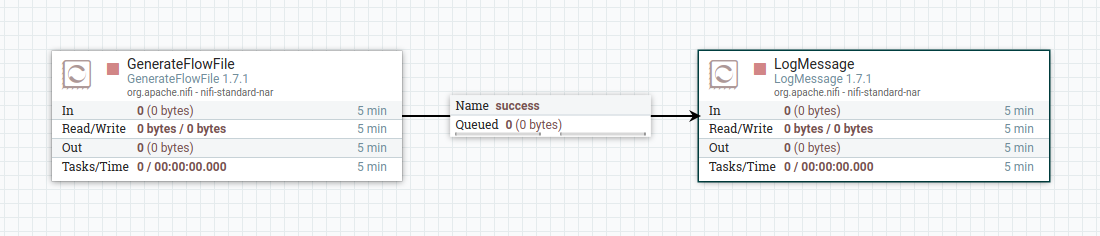
To prove this works, we will utilize the reporting task created above, a generate flow file and log message processor.
Go to localhost:8080 and create this simple flow
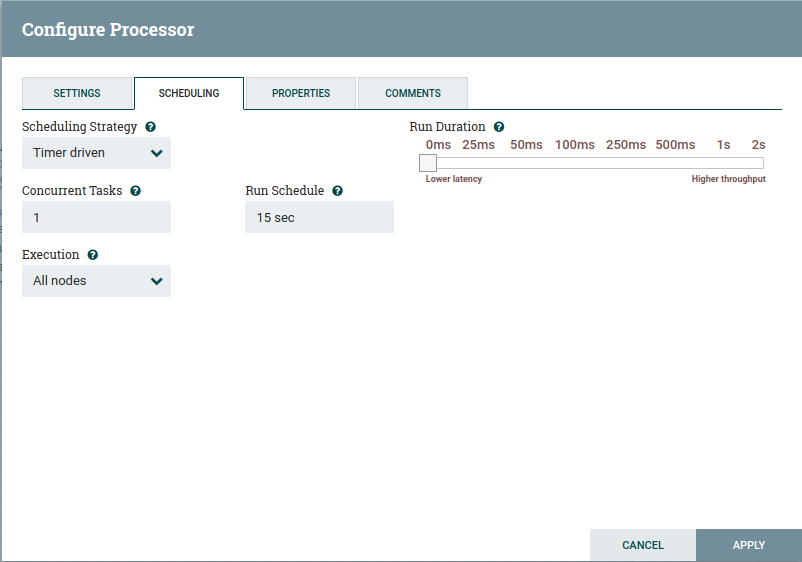
The only change to the generate flow file processor to set the schedular to run at a given interval, I have chosen once every 15 seconds for the example
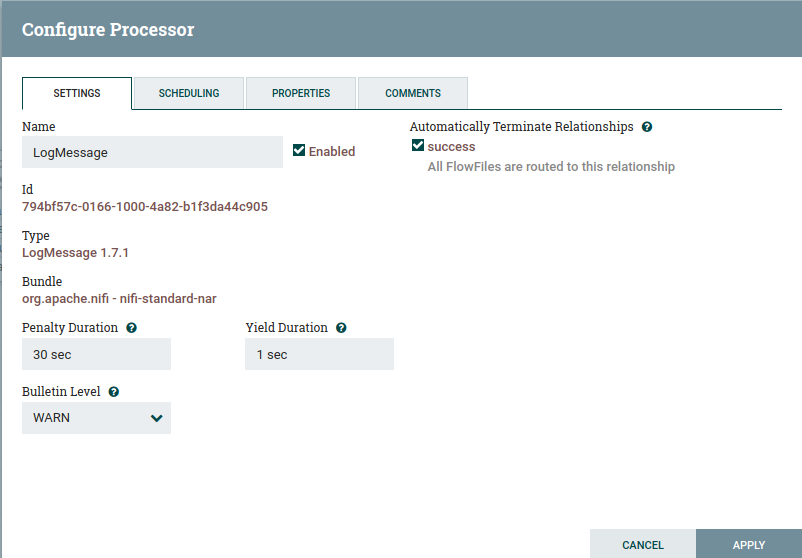
The configuration for the log message processor are also really simple. Set the bulletin level to warn, auto terminate the success output, and then configure the message. This message is trivial.
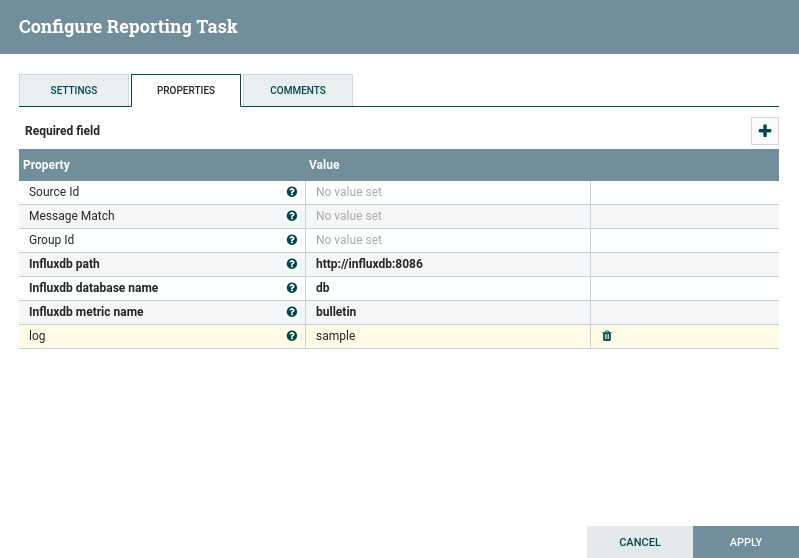
To add the reporting task, go to the dropdown in the upper right, then controller settings, and navigate to the reporting task tab. Click the ‘+’ button on the upper right of the window. You can either search for the InfluxBulletinReportingTask, or just select it since there aren’t many reporting tasks.
Click the pencil icon to edit the newly added reporting task. We will set the scheduled time to match the generate flow file from earlier, to 15 seconds. Then in the properties we will configure the connection to influxdb.

Then hopefully you will be able to start it. Then start your flow as well.
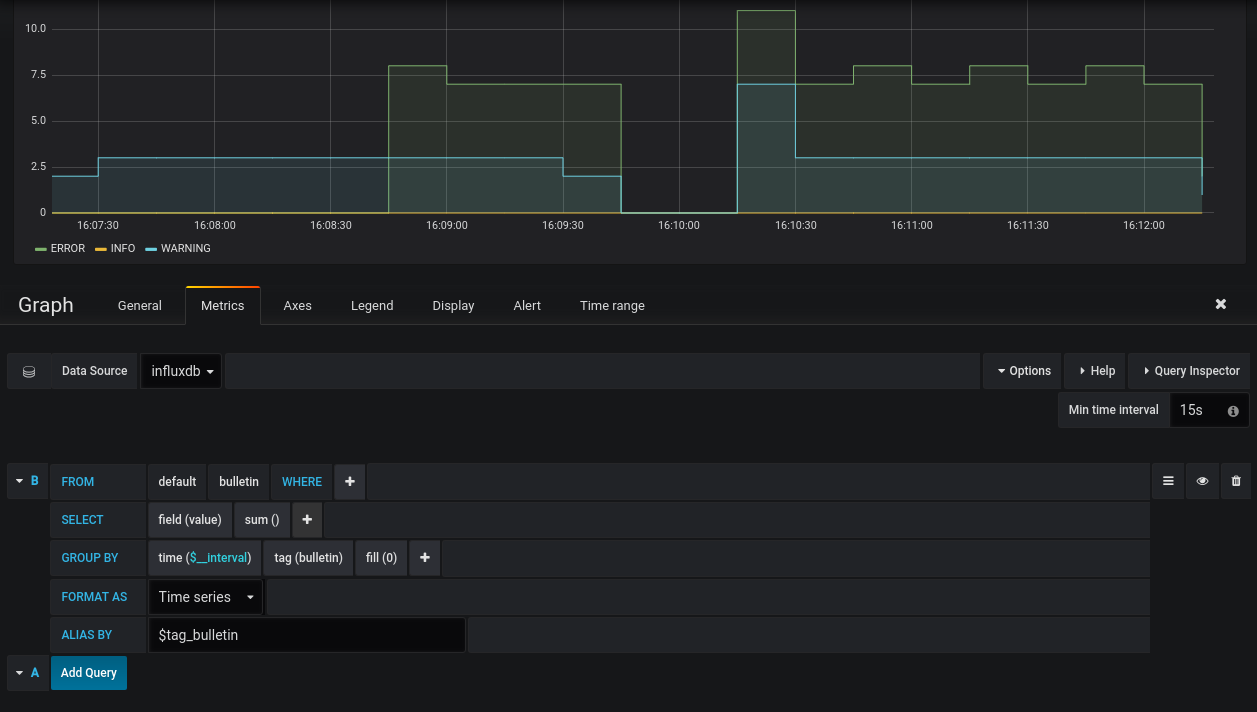
Visit your local graphana, default user name and password are both admin. Add a new dashboard and configure the influxdb database connection. Should be able to produce a graph similar to below.
If you have any questions about custom reporting tasks, let us know below or at info@nifi.rocks!